Dashboard
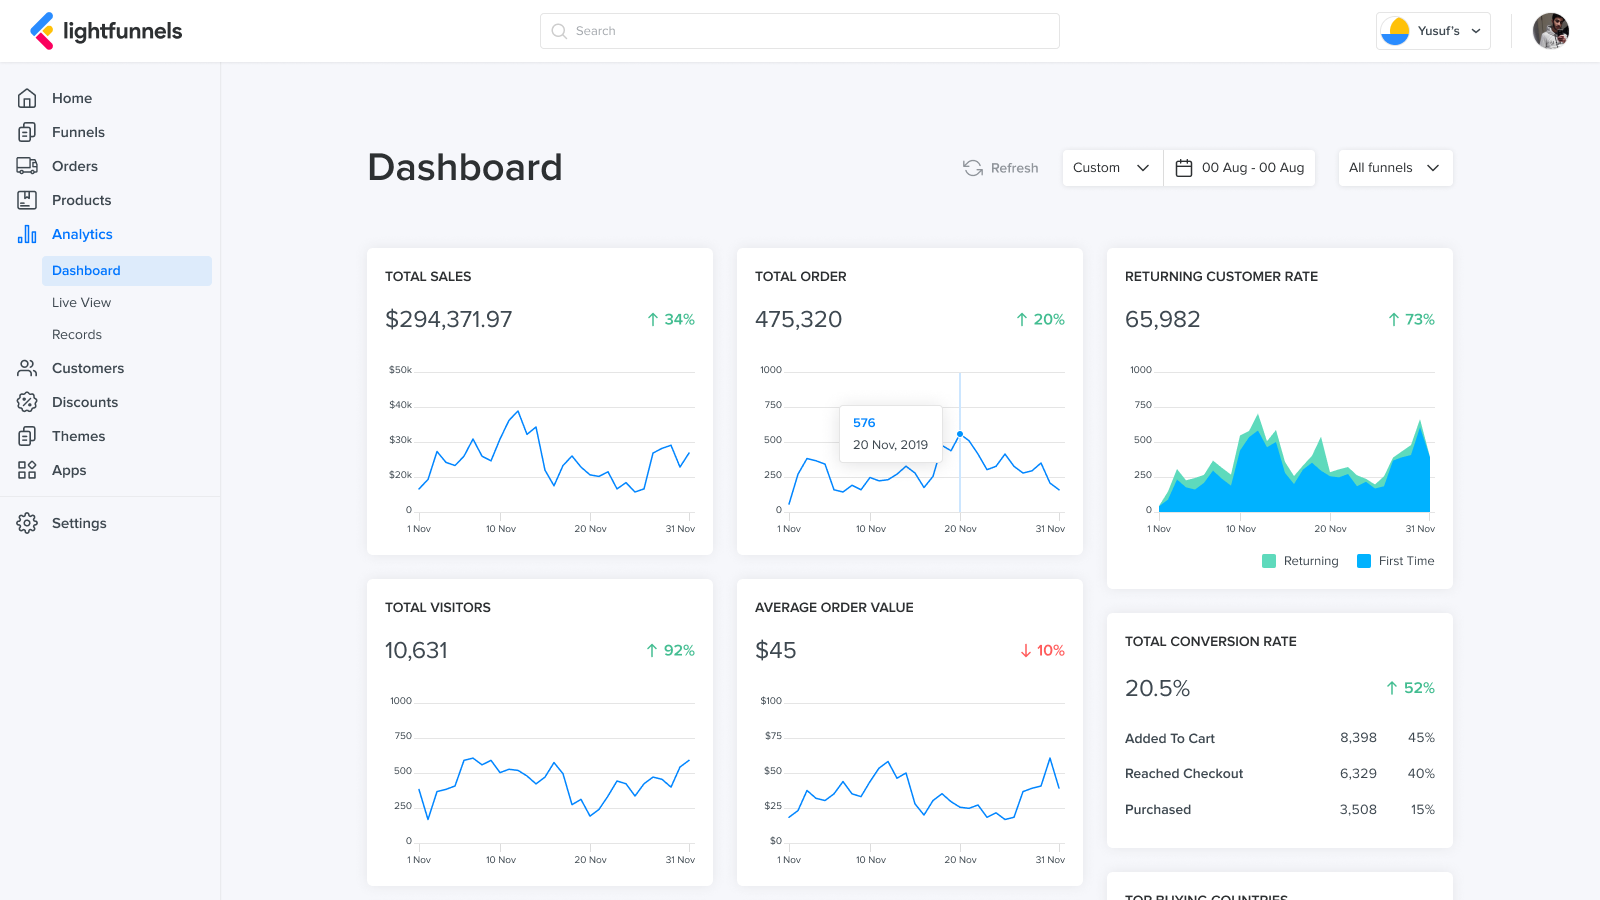
Analytics Dashboard
The Analytics Dashboard gives you an overview of your performance over a period of time.
To open it, go to Analytics > Dashboard.
Filters
Section titled “Filters”At the top right corner of the page you can:
- Select funnel or store: see data for all your funnels and stores, or for one funnel or store only.
- Pick a date range: choose the period you want to see.
- Compare to date: check this box in the date picker to compare with another period. Under Compare To, choose Previous period or Last year.
- Refresh: reload the latest data.
Below the filters, you can switch the currency used to show your sales.
Metrics
Section titled “Metrics”Let’s go over the metrics and their meanings.
| Metric Name | Metric Description |
|---|---|
| VISITORS | The number of visitors to your funnels and stores. |
| SALES | The gross sales amount generated. |
| ORDERS | The number of orders processed. |
| CUSTOMERS | First-time customers versus returning customers. |
| AOV | The average order value: total sales divided by the number of orders. |
| LEADS | The number of leads collected. |
| Conversion Rate | How many visitors added to cart, reached checkout, and purchased, with the percentage for each. |
| UPSELL & OFFERS | The count and total sales of bundles, order bumps, and one click upsells. |
| Top Traffic Sources | How many sales each traffic source has brought you. |
| Top Buying countries | Top countries ordered by gross sales. |
| TOP DEVICE TYPE | Devices your visitors are using the most. |
| TOP selling products | The best selling products, with revenue and units sold. |
| TOP selling funnels | The best selling funnels. |