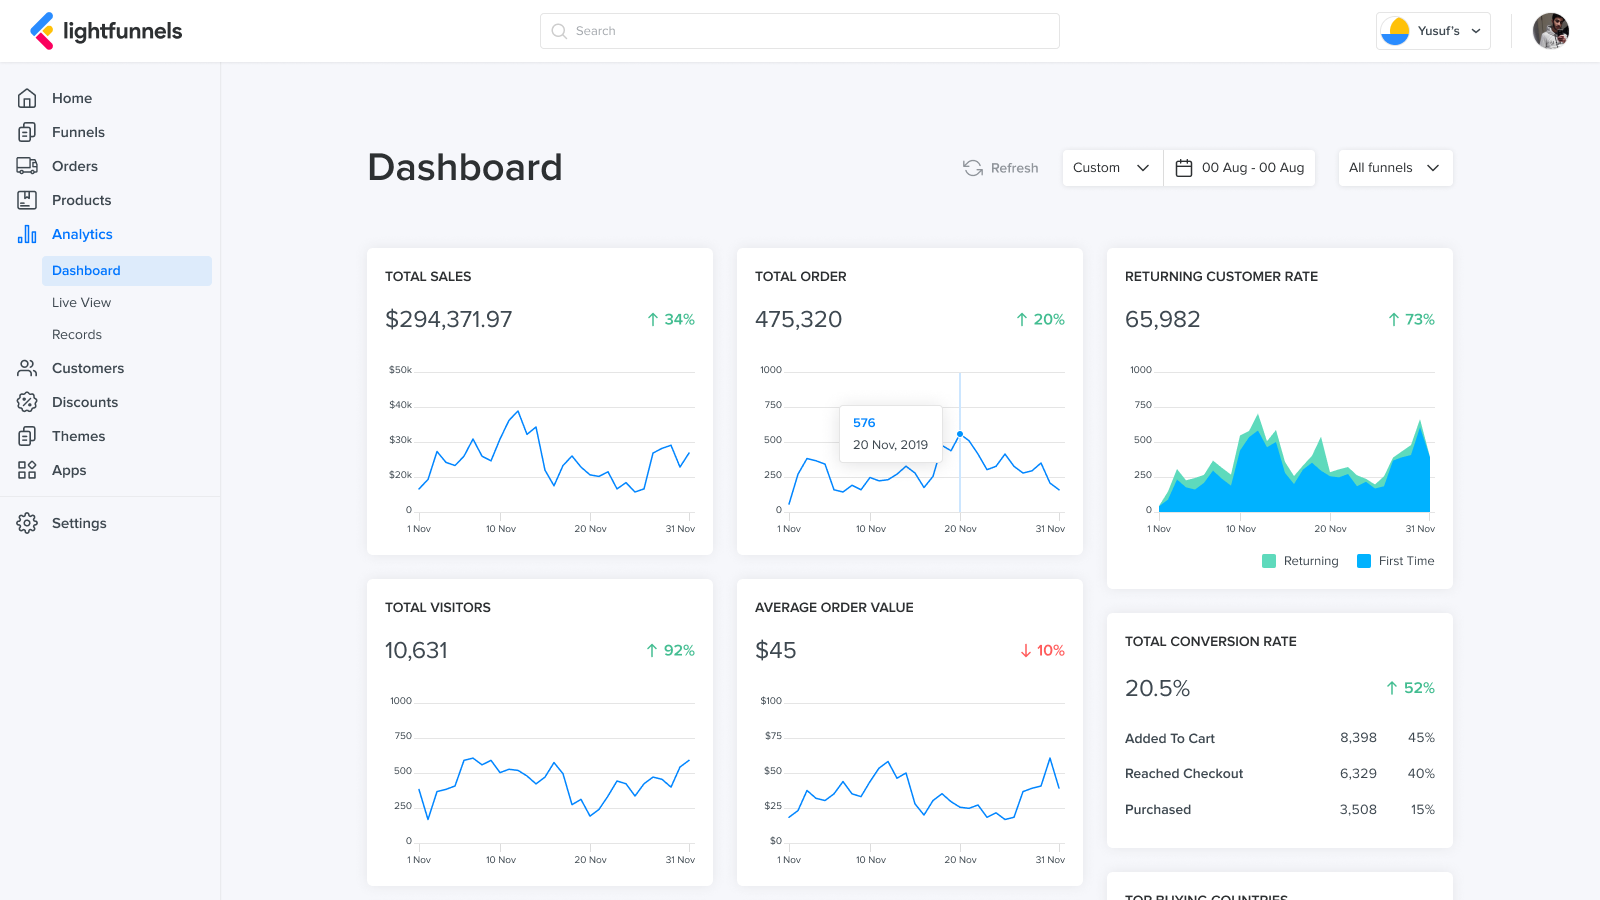
The Analytics Dashboard gives you an overview of your performance over a period of time.
You can see performance for all funnels or for a specific funnel by choosing the funnel that you want at the top right corner.
Let's go over the metrics and their meanings.
| Metric Name | Metric Description |
|---|---|
| Total Sales | The gross sales amount generated |
| Total Orders | The number of orders processed |
| Returning Customers Rate | The number of customers who ordered for the first time versus returning customers |
| Total Sessions | The number of sessions. A session is counted whenever a visitor visits a funnel. The session ends when the visitor stays inactive for 30 minutes. |
| Average Order Value | The total sales divided by the number of orders. |
| Conversion Rates | The percentage of visitors who take an action from the total visits. |
| Total Leads | The number of leads collected. |
| Sales by Traffic Source | How many sales each traffic source has brought you |
| Top Device Types | Devices your visitors are using the most |
| Top Buying Countries | Top countries ordered by gross sales |
| Top Selling Funnels | The best selling funnels |
| Top Products by Units Sold | The products that are sold the most |